Sankey Diagram Gallery
Click on the image of the diagram to load it into Sankey Diagram
app.
Would you like to contribute a diagram to the gallery? In the Sankey
Diagram app, open up your diagram, tap on the help (question mark)
button, tap the Happy button, and then choose "Submit to Gallery" from
the menu.
Feel free to add a node to the diagram that
indicates your name, so that other users know who contributed the new
diagram. If your diagram is based on data from another source, also
include a node that indicates the source of the data.
Satellite Electrical Power Distribution
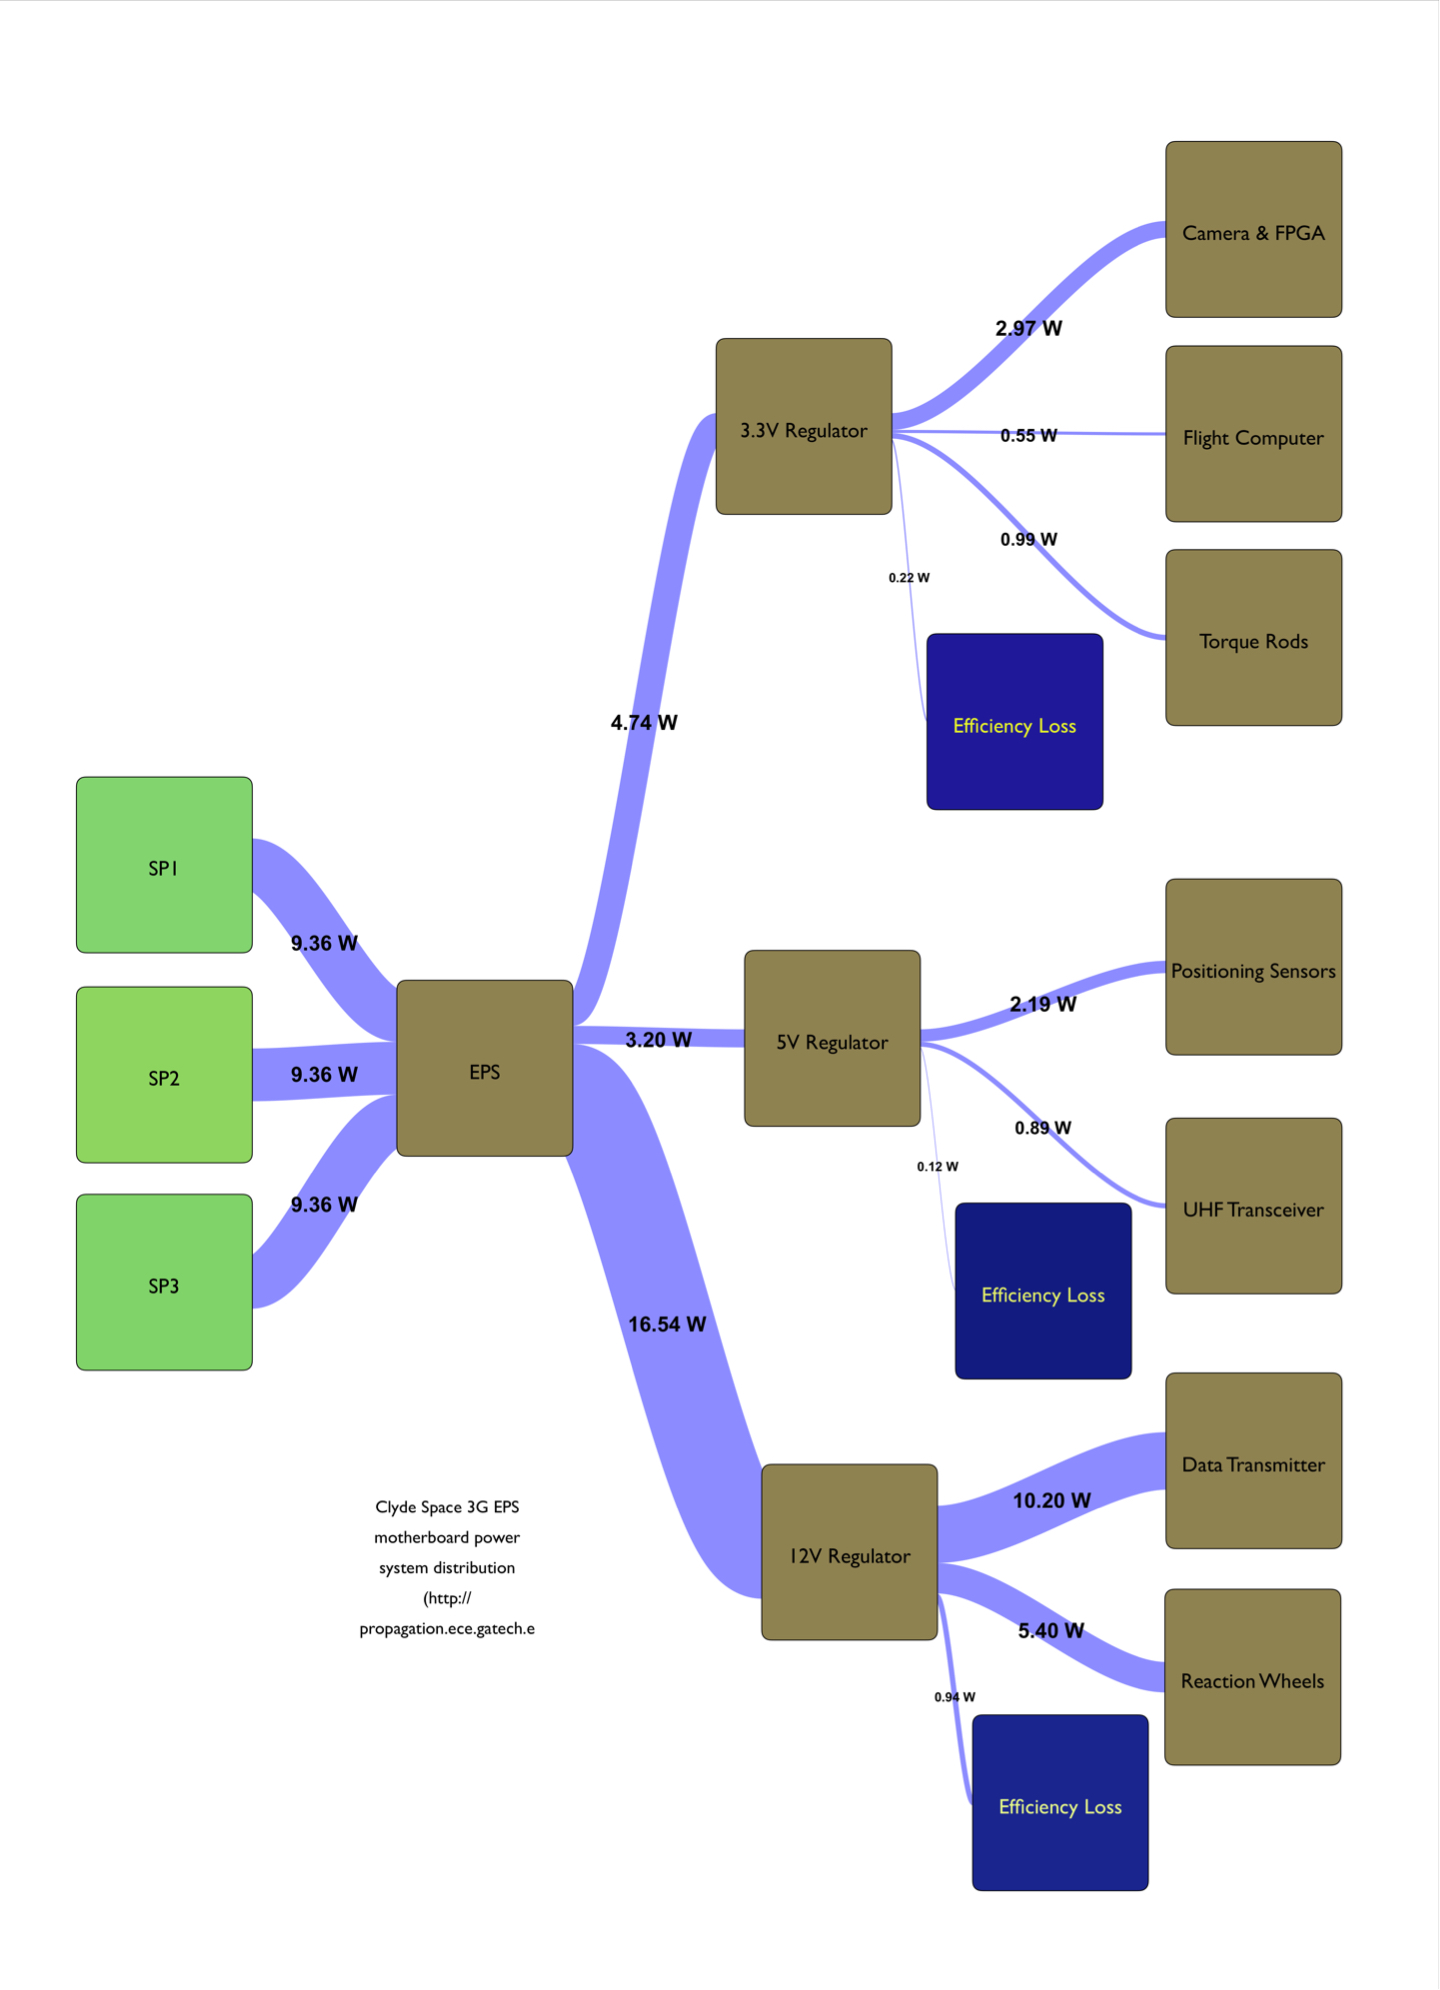
Electrical power from solar panels on the satellite is converted to
three voltage rails to power the devices on the satellite.
http://propagation.ece.gatech.edu/ECE6390/project/Sum2015/team3/PowerSystem.html
US Trade in Motor Vehicles and Parts
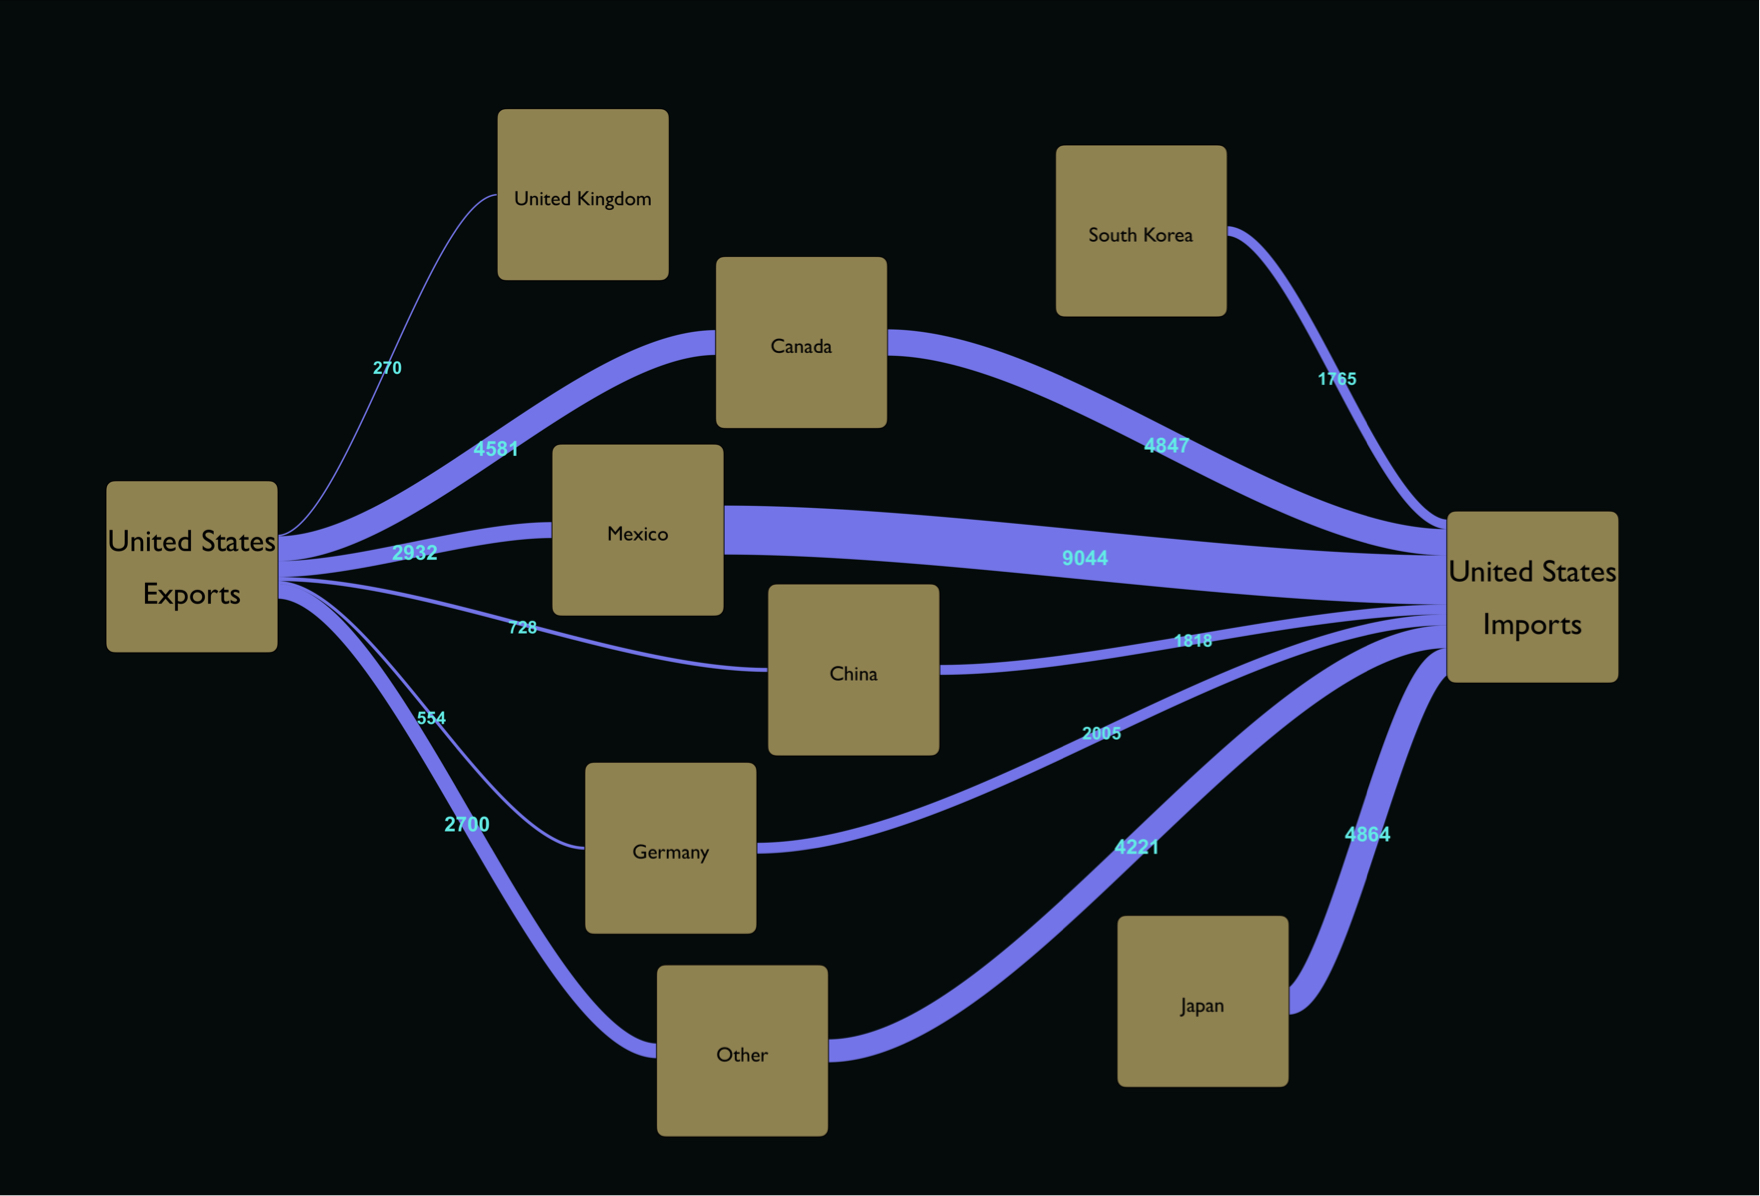
United States imports and exports of automobiles and automotive parts
in January, 2018, by country.
Source: https://www.census.gov/foreign-trade/Press-Release/current_press_release/ft900xls.zip
US Exports
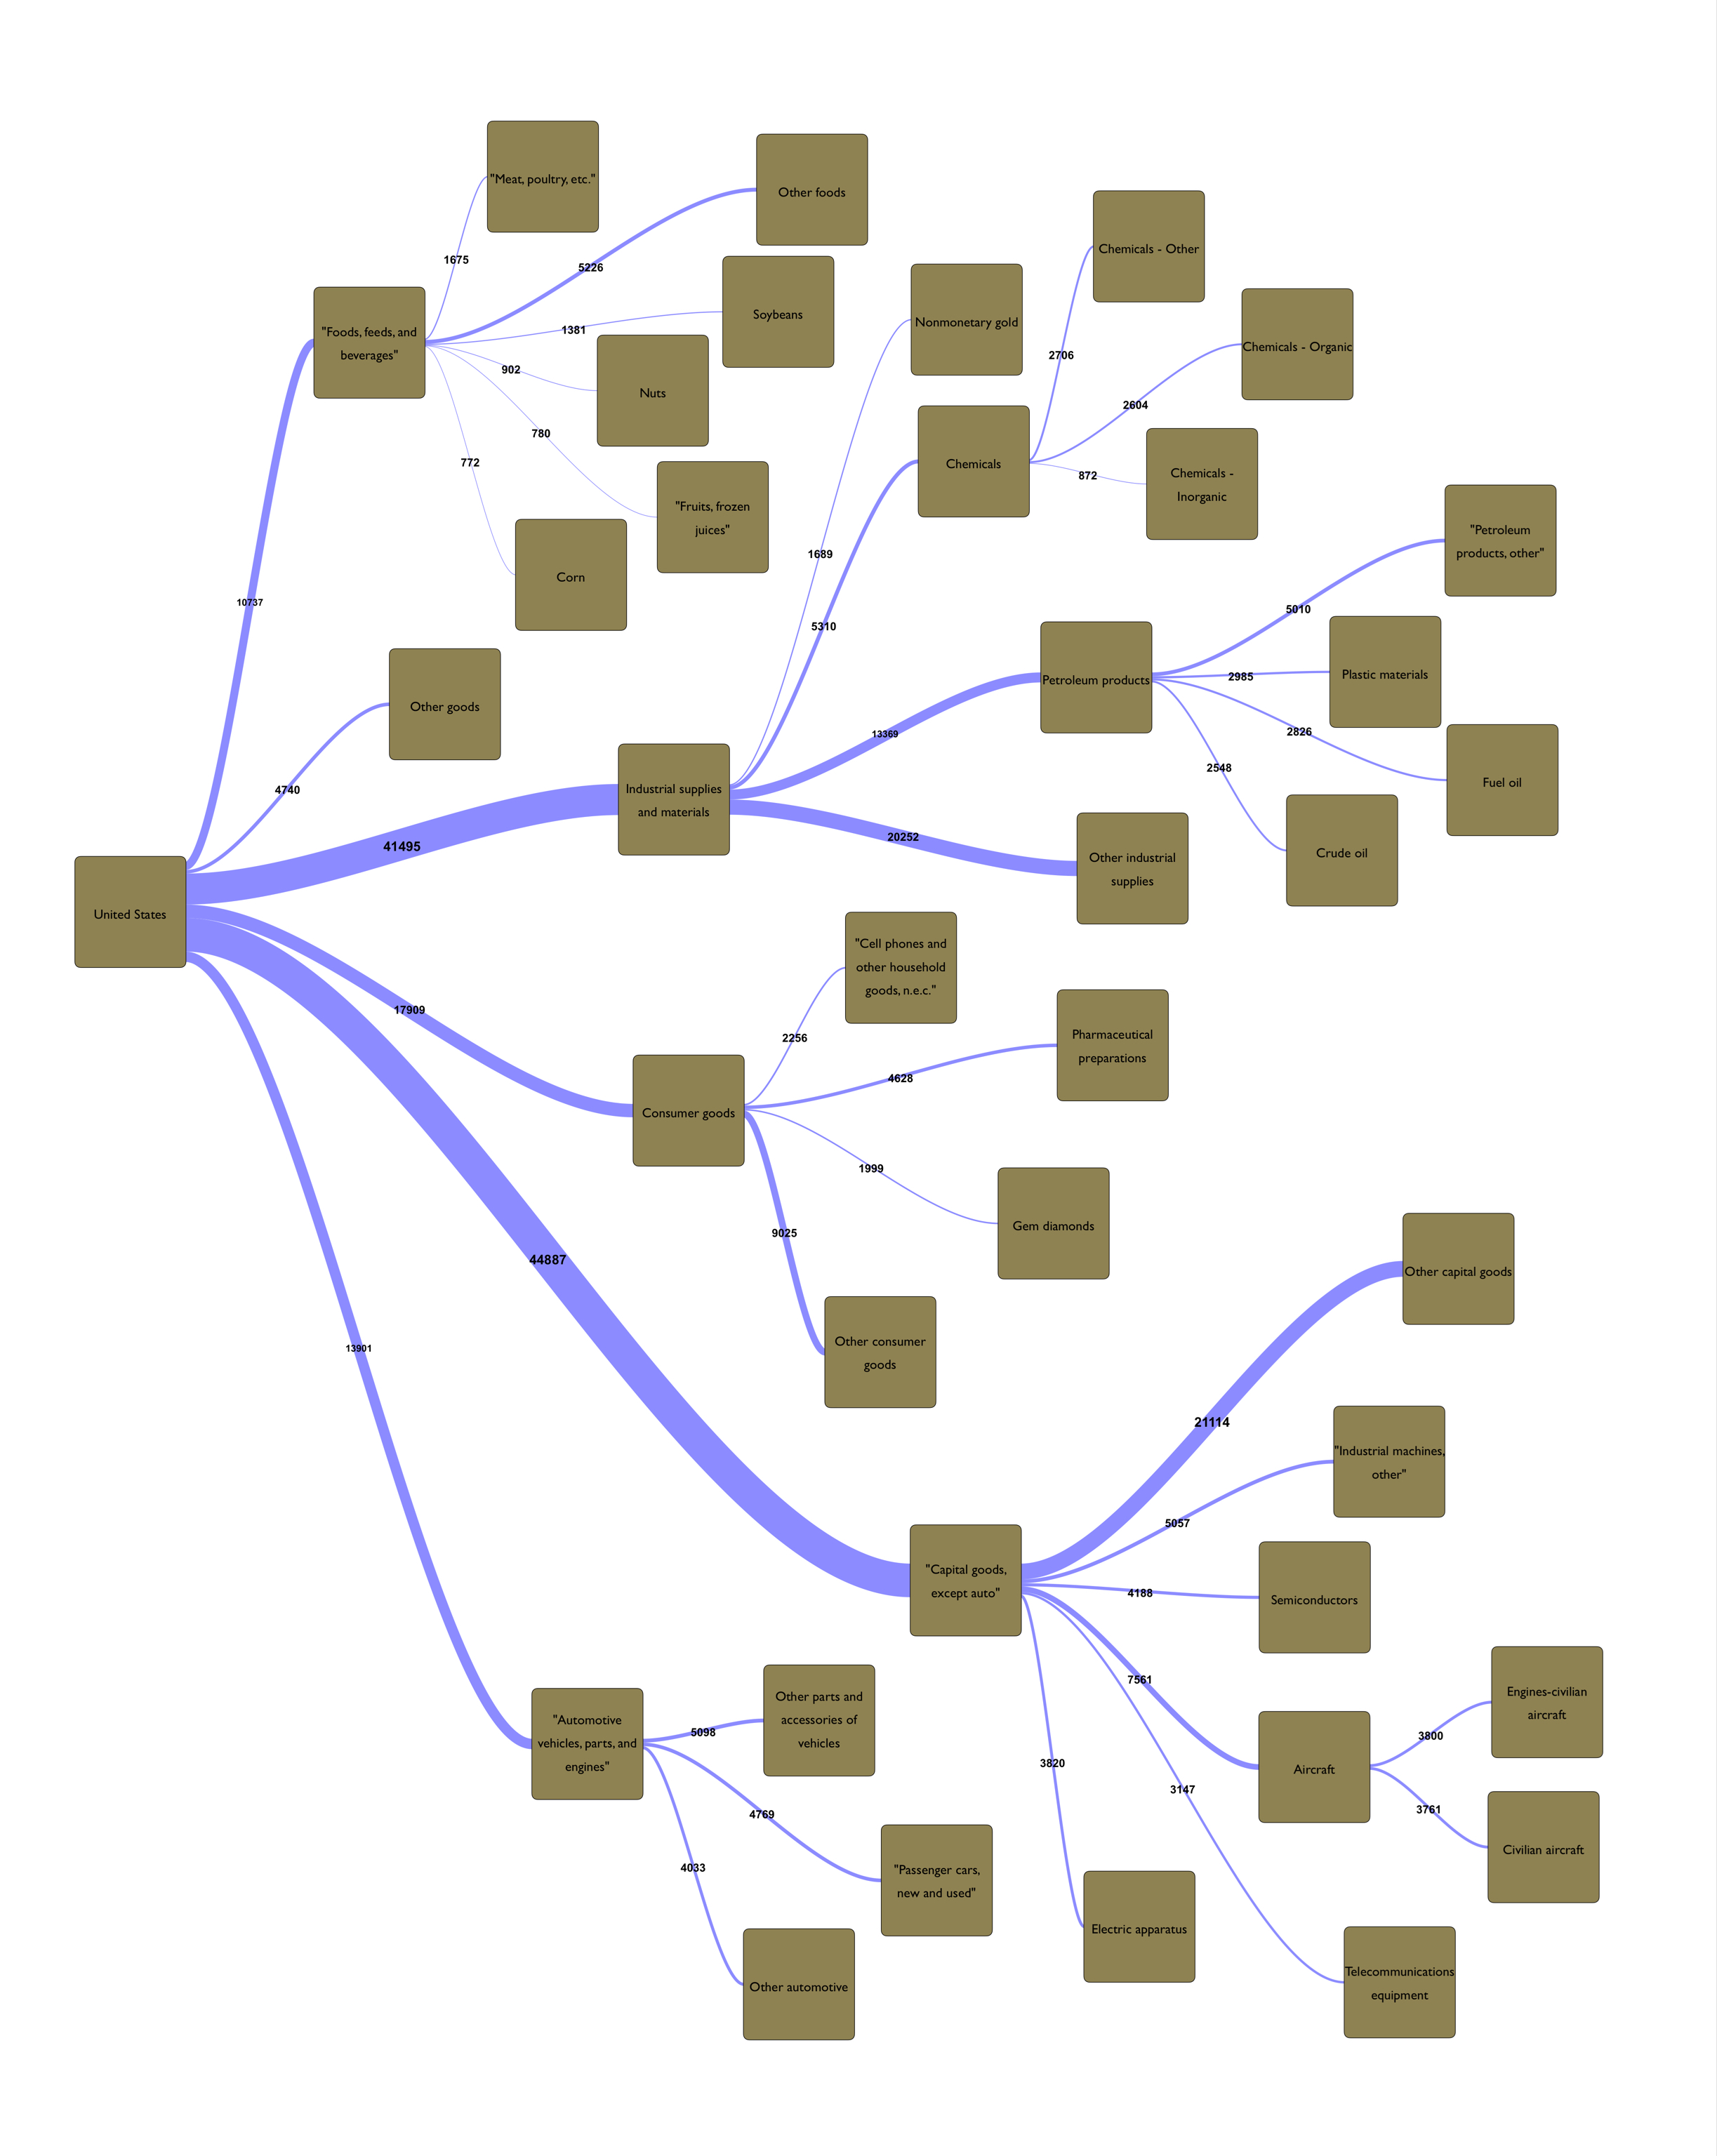
United States exports by commodity type in January, 2018.
Source: https://www.census.gov/foreign-trade/Press-Release/current_press_release/ft900xls.zip
Apple 2013 Income
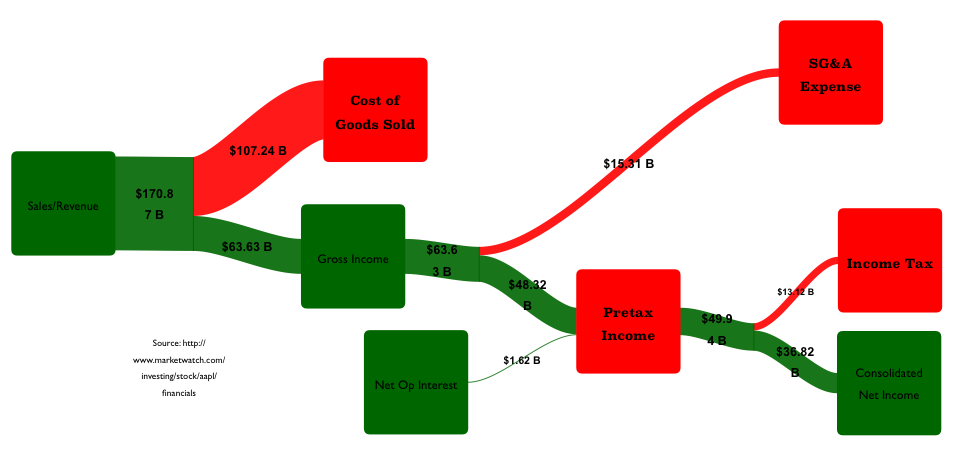
Apple's Income Statement for 2013. Illustrates how their
2013 Sales/Revenue is divided into Cost of Goods Sold, Gross Income,
expenses, etc. Source: http://www.marketwatch.com/investing/stock/aapl/financials.
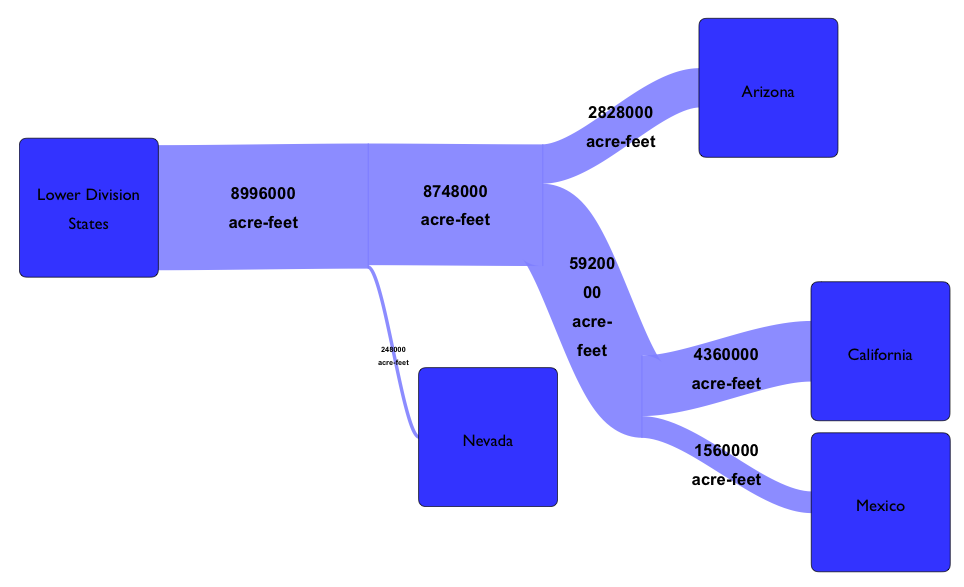
Colorado River Water Use 2012
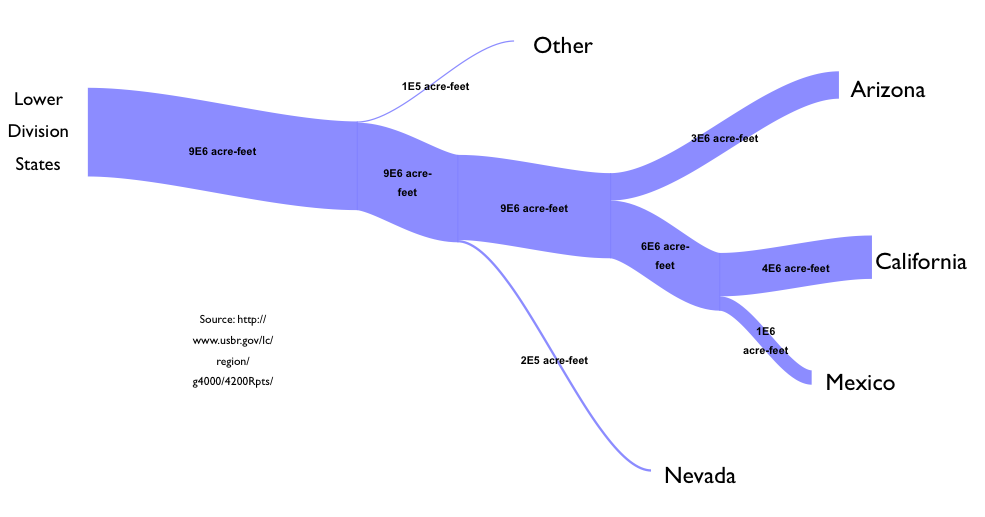
Usage of water from the Colorado River in the western United States
and Mexico. Source: http://www.usbr.gov/lc/region/g4000/4200Rpts/
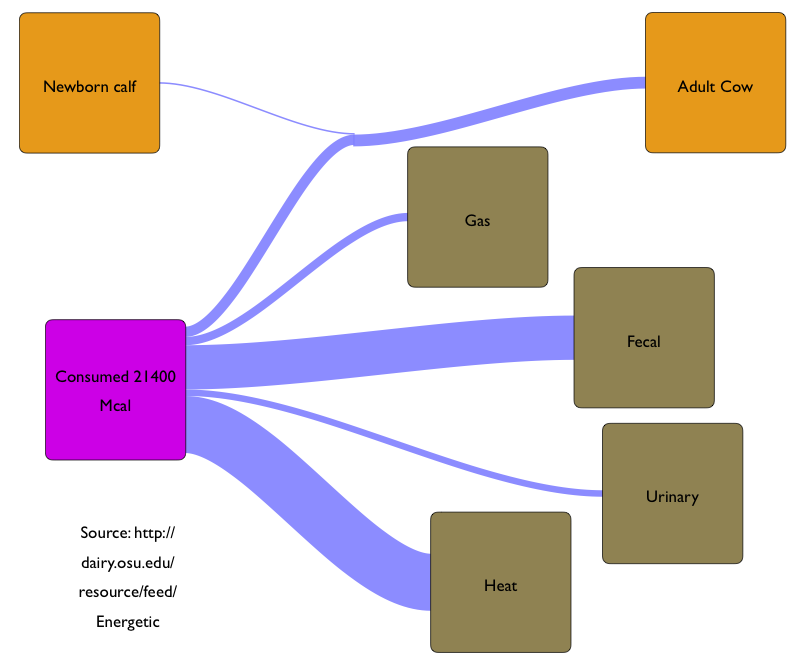
Cow Energy
US Energy Usage
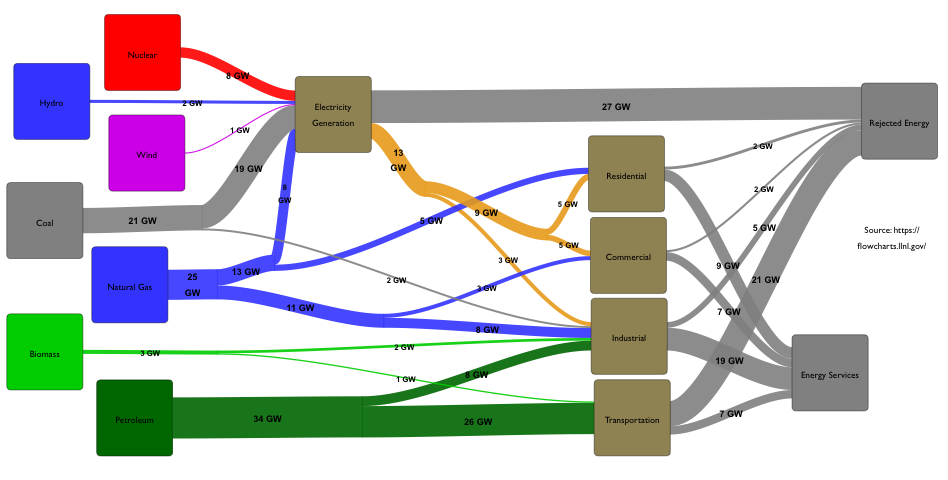
Estimated energy usage in the United States in 2010.
Source: http://flowcharts.llnl.gov
Recycling
Conceptual recycling flow diagram, showing self-referencing flows.
US Consumer Expenditures

Consumer spending in the United States in 2012.
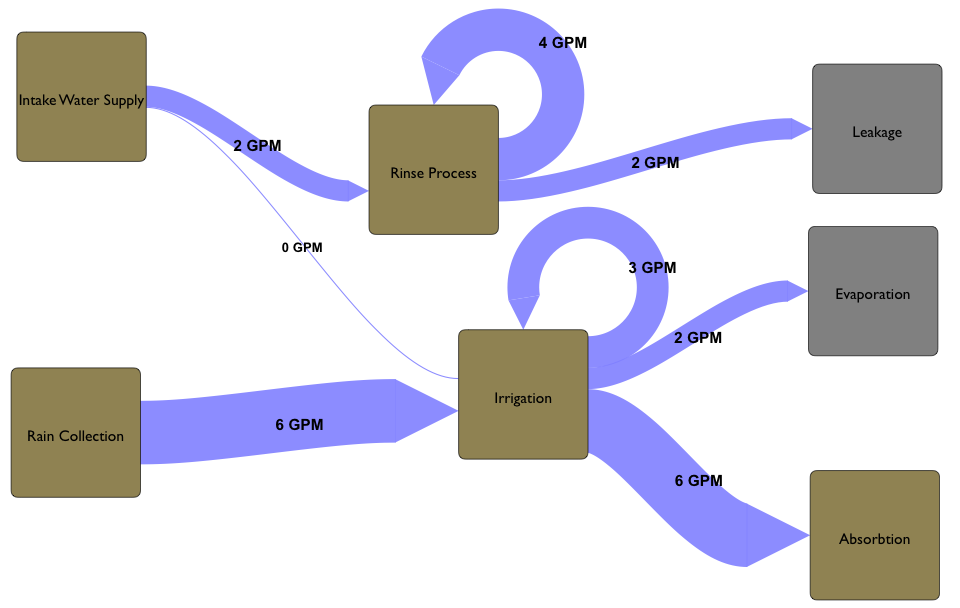
Water Diagram
Usage of water from the Colorado River in the western United States
and Mexico. Source: http://www.usbr.gov/lc/region/g4000/4200Rpts/
(c) 2018, squishLogic LLC